
More training isn’t always better: animated charts showing the dose-response curve reveal the steep growth zone, the plateau where additional volume stops helping, and why minimum effective dose beats maximum possible volume.
Training adaptations don’t scale linearly with volume. Add one set to your routine, you see a measurable improvement. Add ten sets, you don’t see ten times the improvement. At some point, adding more sets produces less benefit per unit of effort. At another point, it produces negative returns: accumulated fatigue, injury risk, and worse performance than a lower volume programme.
This is the dose-response curve of training. Understanding it matters because it’s the difference between efficient progress and wheel-spinning.
What the Curve Looks Like
> The short version: A Scrollchart dose-response curve shows the steep zone where each set produces real gains and the plateau beyond which volume stops helping, clarifying why less strategic volume beats more undisciplined volume.
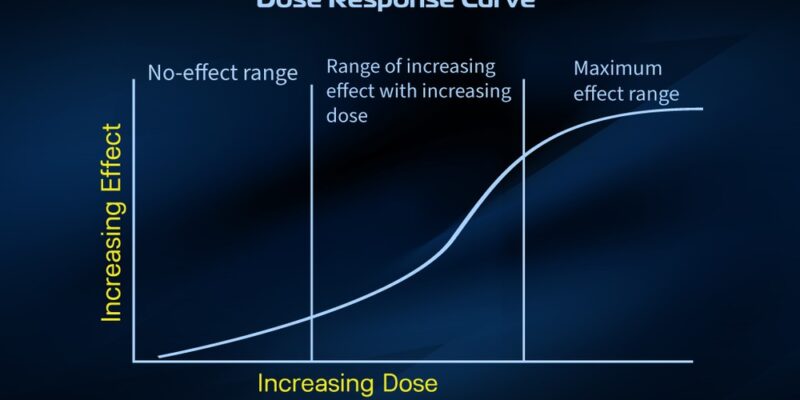
Imagine plotting training volume on the horizontal axis (sets per muscle group per week) and muscle growth (or strength gain) on the vertical axis. The curve doesn’t start at zero. Very low volume produces almost no stimulus. Your muscles aren’t given sufficient mechanical tension to warrant adaptation.
As volume increases from low to moderate, the curve rises steeply. Each additional set produces meaningful growth stimulus. This is the steep part of the curve, where effort is rewarded generously.
As volume continues increasing into moderate to high ranges, the curve continues rising but less steeply. You’re still making progress, but each additional set yields less gain per set. The curve is flattening.
At some point (call it the “optimal volume”) the curve reaches a plateau. Beyond this, additional volume produces no additional growth. You’re doing more work for the same outcome. This plateau is individual and depends on training experience, genetics, recovery capacity, and sport.
Beyond the plateau, the curve might even dip slightly. Excess volume, without corresponding recovery and nutrition, can impair performance, increase injury risk, and actually reduce progress compared to the optimal zone.
Why the Curve Has This Shape
The biological reason comes from how muscle adaptation works. Training creates a signal for adaptation through multiple mechanisms: mechanical tension, metabolic stress, and muscle damage. Once that signal is sufficiently strong, additional volume doesn’t make it stronger. The signal is saturated.
Think of adaptation signalling like a dimmer switch. The first few sets create a bright signal. Adding more sets brightens it further, but your muscles only turn on the adaptation machinery once. It doesn’t run twice as bright if you hit it twice as hard. There’s a ceiling on the response.
Additionally, recovery is finite. Volume accumulates fatigue across your nervous system and metabolic machinery. If you exceed the volume that your sleep, nutrition, and stress management can recover from, you enter overtraining territory. Fatigue accumulates, performance tanks, and adaptation stops. The curve actually becomes negative beyond the point where recovery capacity is exceeded.
Individual Variation on the Curve
Here’s where it gets practical: the optimal volume point on the curve varies dramatically between individuals.
A beginner often sees progress with quite low volume: 3 sets per muscle per week might produce excellent growth. Their muscles are inexperienced and responsive to any stimulus.
An intermediate lifter might need 8-12 sets per muscle per week to hit the steep part of the curve. Their muscles have adapted to low volume, so additional volume is needed to maintain a strong stimulus.
An advanced lifter might need 12-20 sets per muscle per week to stay in the productive zone. Their muscles are tough to stimulate because they’ve adapted to whatever volume they’ve been doing.
But “advanced” doesn’t mean unlimited. Even elite lifters have a curve ceiling. Most research suggests that beyond 20-30 sets per muscle per week, adaptive returns diminish sharply or reverse. The individual variation is in where the plateau occurs, not whether it exists.
Practical Positioning on the Curve
The goal isn’t to find the maximum possible volume. It’s to find the minimum effective dose: the volume at which you’re still driving adaptation while preserving recovery capacity and avoiding injury risk.
For strength goals, the evidence suggests 4-12 sets per muscle per week, depending on experience level. This is surprisingly modest. The steep part of the strength-building curve is narrow.
For muscle growth (hypertrophy), the suggested range is 10-20 sets per muscle per week. The curve is slightly more forgiving; a wider range produces growth. But beyond 20, you’re likely on the flattening part of the curve.
For muscular endurance, moderate volume (6-12 sets per week) with higher reps and shorter rest periods hits the curve well.
The specificity matters: a set means a working set taken close to mechanical failure, not warm-up reps. 5 warm-up sets at 50% then 3 working sets at 90% counts as 3 sets. This distinction collapses sloppy volume counting and explains why high-volume “bro splits” sometimes underperform despite the raw number of sets.
How to Find Your Position
Pick a muscle group and an exercise (bench press, leg press, rows). Count your current weekly volume.
Maintain that volume for 3-4 weeks, tracking performance (reps, weight, difficulty).
Increase volume by 2-3 sets per week and maintain for another 3-4 weeks, tracking again.
Continue until you notice diminishing progress or increasing difficulty recovering between sessions. That’s your proximity to the plateau.
Back off by 1-2 sets. That’s probably near your optimal zone.
Most people find their sweet spot is lower than they expect. A high-schooler convinced they’re advanced might discover they’re still in the beginner part of the curve. An advanced lifter might realise their current 30-set-per-week program is on the plateau, and dropping to 18 sets while increasing intensity works better.
The Recovery Ceiling
Volume’s real ceiling isn’t physiological; it’s practical. You can’t recover from unlimited volume because recovery is limited. You have a fixed amount of sleep (ideally 7-9 hours). You have a fixed appetite and digestive capacity. You have a fixed amount of time and mental energy.
This is why volume recommendations are contextual. A professional athlete with one job (training) and excellent sleep can sustain more volume than a person working 50 hours, sleeping 6 hours, and managing ongoing stress. Their recovery ceiling is higher, so they can position further up the curve.
If you’re trying to add volume but can’t improve recovery (more sleep, better nutrition, stress reduction), you’re trying to push the curve upward without the capacity to sustain it. You’ll hit diminishing returns or negative returns faster.
Practical Application
The curve teaches a clear principle: your goal isn’t to do as much volume as possible. It’s to do as little volume as works, positioned on the steep part of your curve where effort rewards you substantially.
For most people, this means:
Staying in the 8-18 sets per muscle per week range, depending on experience.
Prioritising intensity (proximity to mechanical failure) over volume. High-intensity lower-volume work often outperforms low-intensity higher-volume work on the curve.
Adding volume gradually in 2-3 set increments and testing if progress improves. Don’t assume more is better; measure.
Matching volume to your current recovery capacity. If sleep is poor or stress is high, reduce volume slightly. The curve shifts downward when recovery capacity drops.
Testing your position on the curve every 8-12 weeks. Your optimal point changes as you adapt.
Visualising the Response
Understanding this curve at an intuitive level is the difference between training intelligently and just following a random high-volume programme. When you can see the dose-response relationship unfolding, when you see how volume below the threshold produces no progress, how the steep part of the curve rewards each set substantially, and how the plateau creates a wall beyond which volume doesn’t help, the logic of moderation becomes obvious.
Animated charts can show how different volumes produce different adaptation rates, how individual curves shift with training experience, and how the plateau varies between individuals. Seeing this visually, through tools like Scrollchart, makes the principle concrete in a way that words alone struggle to convey.
The Takeaway
You don’t need the maximum possible volume to drive results. You need to be on the steep, productive part of your personal dose-response curve. For most people, that’s surprisingly modest: 10-15 sets per muscle per week, focused on intensity and recovery. More volume can help you progress, but only until you hit the plateau. Beyond that, effort doesn’t translate to results.
Find your curve. Position yourself on the steep part. Progress will follow.
Frequently asked questions
How do I find my optimal volume without experimenting for months?
Start with moderate volume (10 sets per muscle per week), track performance for 3-4 weeks, add 2-3 sets and track again. Repeat until progress slows noticeably or recovery worsens. Back off by 1-2 sets. That proximity is likely your steep zone. Most people find optimal volume is lower than expected, often 8-15 sets depending on experience and recovery capacity.
Why do some people progress on high volume and others on low volume?
Training experience, sleep quality, stress level, and genetics all shift where the plateau occurs on your curve. Advanced lifters with excellent recovery can sustain 20-25 sets per muscle per week. Busy professionals with poor sleep might progress best at 6-10 sets. Your recovery ceiling determines your volume ceiling; match volume to your actual recovery capacity, not your aspirations.
Does a Scrollchart help me understand dose-response better than a static graph?
Yes. Seeing the curve rise steeply in the low-to-moderate range, then gradually flatten, then potentially dip negative at extreme volume makes the biology intuitive. Animated overlays showing how different training experiences shift the curve, how recovery capacity affects the plateau, and how frequency interacts with volume per session clarify the principles words alone can’t convey.


Comments